Hellen Rostron – Brainboxes
Big Data – shorthand for the billions of transactions datasets generated daily – is key in industry, but simply collecting reams and reams of counts and figures isn’t enough. The data must of course be accurate and relevant. Moreover, it’s vital that it can be analysed in the right way to enable businesses to make the best data-driven decisions.
The actionable insights are already there, contained in the data. Data visualisation – viewing information in clear graphical forms – takes the guesswork out of analysing big data by cutting out the noise and making it easier to spot trends, patterns and unusual values (outliers.) Often complex statistical analysis isn’t required; simply visualising data allows humans to understand the big picture unclouded by individual data points.
The ability to visualise data from different sources in one place makes it easier to identify organisational opportunities, shines a spotlight on inefficiencies, and can help solve other common challenges on the factory floor:
Reduce costly errors
To err is human; the ability to spot inevitable mistakes in real-time and respond quickly can make a huge difference.
Representing data from varied sources on a centralised visual dashboard allows supervisors to see everything at a glance (shift productivity, machine downtime, outputs, etc.), making it easier to keep track of every part of the manufacturing process and action fast responses.
Streamline the supply chain
By visualising data at any given time, and comparing against historical performance data, it’s easier to track ROI and delivery rates, identify where resources are allocated, and manage Overall Equipment Effectiveness to optimise supply chain efficiency.
Balance quality control with cost-cutting
A visual data model makes it easy to see where resources are spent and proactively identify potential flaws; ensuring that all processes are designed to meet quality assurance standards in the most cost-effective way. Quality doesn’t always have to come at a price; some of the largest quality gains can be made by simple changes highlighted by the data.
Identify & eliminate inefficiencies
Enterprise Resource Planning (ERP) is the measurement and management of critical processes, often in real-time. By visualising datasets related to resources, materials, productivity, and shift performance in a comprehensive database, ERP can be enhanced, allowing decisions to be made more rapidly and with fewer errors.
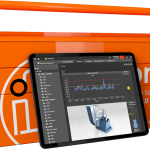
Wherever you are on your IoT journey, graphically visualising data makes it possible to optimise operations. Even without the facilities to capture data, it’s possible to prove concepts without wiring sensors, by using free to start, open-source software and Brainboxes BB-400 Industrial Edge Controller.
Watch the video guide to learn how sensor count data can be captured by the BB-400, and sent to a time-series database in InfluxDB, which will allow us to create graphical visualisations of the data in Grafana in the form of charts, graphs, and more.
Read More: FAQ – How Can I Send IO Count Data to InfluxDB & Grafana?
For more information contact: sales@brainboxes.com

